Home Overview
The home screen is the starting point for navigating to other sections and provides all the basic functions for playback.
The graphic provides an overview of the session.
Navigation

The navigation bar is located at the top of a page.
Graphics
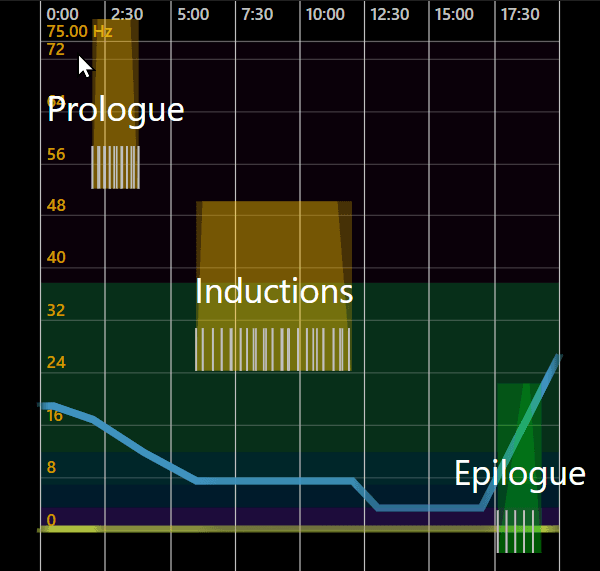
In the centre, a graph shows the basic timeline of a session.
- CurvesThese show the progression of the generators’ brain frequencies. In addition, their volume is represented by the transparency
- Speech blocksAs well as the start, end and name, these also display the following:
- The fade-in and fade-out indicated by the steepness of the side lines
- The start of a speech recording, indicated by the white lines at the bottom
- How the speech recordings are played back: in a loop (yellow), all once in succession (green) or not at all (grey)
Functions
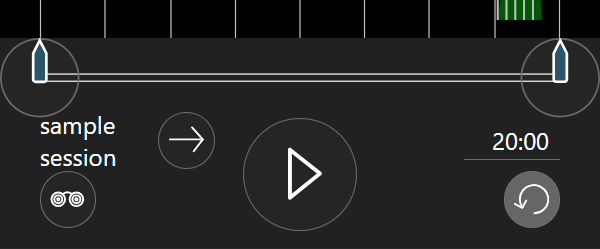
All the functions are located at the bottom of the page.